Chemistry Guide
Information and Safety
General Information
- Workspaces will be assigned during the first laboratory period. Your space contains the vast majority of equipment that you will need for this course. It is not the policy of the chemistry department to demand a deposit for this equipment or to require that you pay for broken or missing equipment. However, it is to your advantage to work in a manner that reduces breakage. Breakages cost money. Money that will not be available for the purchase of other equipment or supplies to broaden your exposure to chemistry. As well, there is the inevitable blood to clean up off the floor. If something breaks, clean it up and dispose of it in the glass container, then ask the technician or the instructor for another one.
- The assigned workspace will be yours for the semester. Wash up your equipment and rinse it with distilled water before you leave the lab. This will give it time to dry before the next period. Do not leave it to next week!
- The proper functioning of the chemistry laboratory
requires the
cooperation of everyone in the lab.
- Do not waste chemicals. Take what you need, pouring chemicals directly into your container. Remember to label all chemicals and PUT THE TOP BACK ON THE REAGENT BOTTLE! Avoid the use of any instrument to transfer the reagent. This will reduce the chance of YOU contaminating the entire bottle. Likewise, do not return excess chemicals but dispose of them as directed.
- Clean up any spills immediately. Not to do so could be very dangerous and expensive.
- Conduct all operations that use or produce malodorous compounds in the fume hood.
- Do not abuse the balances. They are very expensive to purchase and repair. Never weigh hot objects - let them COOL. If it is too hot for you to pick up in your hands, then it is TOO HOT TO WEIGH.
- Do not dispose of insoluble or organic compounds in the sink. Use the appropriate receptacles.
Safety
The potential for injury and accident is very high in the chemistry lab. Yet each year, thousands of people work in chemistry labs without incident. Why? They have realized that it is much easier to prevent an accident than try to repair the consequences of one. The prevention of accidents requires that you learn proper procedures, think about what you are doing, and pay strict attention to your work. The rules listed below have evolved over the years to provide you with a guideline for reducing the possibility of serious accidents. It is essential you follow them. Insist that everyone does! It may be someone else's carelessness that involves you in an accident!
Working Safely in The Lab
The following suggestions are presented with the aim of eliminating the minor cuts, burns, etc. that occur to beginning students.
- Wash hands upon entering and exiting the laboratory (use hand sanitizer frequently if you are experiencing cold symptoms, such as a runny nose, a sore throat, or you are coughing).
- The insertion of glass tubing or thermometers into rubber stoppers causes a large number of cuts - some very serious. If the glass is fire polished and the correct size for the hole, you proceed as follows. Use a lubricant: H2O, or better, glycerin. Hold the tube 3 cm from the stopper and insert with a twisting motion. Do not force it. If properly done, very little force is required.
- Remember hot objects look very much like cold ones! Think before you touch it! If it's hot, use the appropriate tongs in your locker.
- Keep your workspace neat. If you no longer need something, wash it and put it away.
- If something falls, let it. Do not try to catch it. You will only make the situation worse.
- Be careful heating liquids. If in a test tube, do not point it at anyone. If flammable, do not use a gas burner.
- Concentrated acids are added to water.
- Be especially careful with bases like NaOH. They can cause irreversible eye damage even in dilute concentration.
- If in doubt, ask your instructor. It costs so little, while an accident can cost so much.
Lab Safety Rules
- Approved eye protection must be worn at all times in the
laboratory
- Standard glasses are not sufficient protection. Wear goggles or safety glasses over them.
- Do not wear contact lens in the lab even while wearing goggles. Vapors can be trapped under the lens and cause irreversible eye damage.
- A lab coat and closed shoes must be worn at all times. These will provide personal protection against chemical contamination, fire and spills to say nothing of your clothes.
- Eating or drinking in the lab is strictly forbidden. You must also leave your water bottles outside the lab. Aside from the fire hazard, the possibility of contamination is too great. Never taste, smell or touch chemicals unless expressly directed to the contrary. It is also advisable not to bring food products (for consumption elsewhere) into the lab as they can absorb toxic vapors.
- All injuries, burns, etc. must be reported to the instructor immediately.
Proposed Schedule of Laboratory Experiments
General Chemistry 202-SN1-RE & Solutions Chemistry 202-SN2-RE
- Adjustments may occur as needed
| General Chemistry 202-SN1-RE | |
|---|---|
| Experiment # | Experiment Name |
| 1 | Basic laboratory techniques and uncertainty |
| 2 | Mass and density measurement |
| 4 | Water of hydration |
| 5 | Conversion of a carbonate to a chloride |
| 6 | Stoichiometry of a reaction |
| 7 | Anion analysis |
| 8 | Molar mass of magnesium |
| LAB TEST | |
| Solutions Chemistry 202-SN2-RE | |
|---|---|
| Experiment # | Experiment Name |
| 1 | sMolecular weight by freezing point depression |
| 2 | Chemical kinetics |
| 3 | Determination of the concentration of Fe |
| 4 | Le Chatelier's principle |
| 5 | Gram-equivalent weight of a solid acid |
| 6 | Acids, bases, and their salts |
| 7 | Hardness of water |
| 8 | Titration |
Organic Chemistry 202-SNU-RE
- Adjustments may occur as needed
| Organic Chemistry I 202-SNU-RE | |
|---|---|
| Experiment | # weeks |
| Introduction and laboratory safety | --- |
| Synthesis, purification and analysis of acetylsalicylic acid or acetaminophen | 3 |
| Thin-layer chromatography | 1 to 2 |
| Infrared spectroscopy and refractive indices | 1 |
| Extraction | 3 |
| Distillation | 1 to 2 |
Lab Notebook & Prelab Assignment
What you need...
A separate spiral bound notebook (one where the pages cannot be removed). This will be your chemistry lab notebook.
What to do before each lab session...
To make maximum use of the time you spend in the lab, you must know what you are to do and what you are expected to observe. It is virtually impossible to perform the mechanical manipulations in the time allotted or to observe anything if you are always looking at the lab manual. Thus, it is your responsibility to read the material related to the laboratory, understand it and prepare your lab notebook for the start of each lab period. If there are procedures or calculations that you do not understand, see your instructor before the lab.
This prelab assignment will be prepared and marked individually before the experiment actually begins.
Prelab Assignment
The prelab assignments will constitute 7% of your total mark for the class. The prelab is prepared and corrected individually.
To prepare your prelab in your lab notebook you must:
- Read the procedure for the experiment on my website
- Use an ink pen (erasable ink is forbidden)
- As shown in the sample prelab below, prepare data tables with sufficient space to record all the data you collect during the experiment for the number of trials required, as well as for all calculated and theoretical values.
- Include all calculations
- Answer any questions
- Only when asked for by the professor, Present a Table of Physical Properties of all organic compounds and/or reactants used during the experiment. Look up needed data in the Handbook of Chemistry and Physics, or another reference book, for example The Merck Index. For General Chemistry and Solutions Chemistry courses prepare the Table of Physical Properties only when requested by your professor. An example is provided below in the sub-section Sample Prelab Assignment.
- Hand-in the prelab according to the predetermined date.
What to do during each experiment...
Upon arriving at the laboratory, you will be given a printed copy of the procedure to follow.In your lab notebook, record, in ink:
- All procedural changes
- All data obtained during the experiment. If you make a mistake, draw a single line through it and write in the correct value. Remember this is not supposed to be a work of ART. Scrap pieces of paper will disappear!
Sample Prelab Assignment
Density determination of an unknown liquid
Obtain a 100 mL Erlenmeyer flask and solid rubber stopper to fit. Carefully clean and dry the 100 mL Erlenmeyer flask. Weigh the flask and a rubber stopper to the nearest 0.01 g. Transfer 10.00 mL of the unknown liquid into the flask, using a 10-mL pipet. With the rubber stopper in place, weigh the flask, liquid and stopper to the nearest 0.01 g. Add another 10.00 mL of the unknown liquid, using the 10.00 mL pipet, to the 10.00 mL already in the flask. Replace the stopper and reweigh the flask. Continue in a like manner until a total of 50.00 mL has been added. Record the temperature of the unknown solution using a thermometer. Remember to use the thermometer clamp and a ring stand to securely hold the thermometer during the measurement. Clean and dry the Erlenmeyer flask and repeat the additions of 10.00 mL of unknown and weighing, until a total of 50.00 mL has been added. Repeat this procedure again to obtain a third set of data. Calculate the densities, the average density, the standard and relative deviations, and the percentage error.
Sample PRELAB assignment
| Substance/Reagent | MW (g/mol) | Density (g/mL)* | mp (ºC) | bp (ºC) | Solubility |
|---|---|---|---|---|---|
Dichloromethane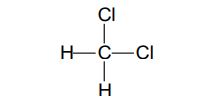
|
84.933 | 1.3266220 | 97.2 | 40 | sl H2O msc EtOH, eth s ctc |
1,2-dichloroethane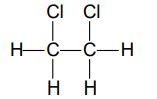
|
98.959 | 1.245425 | -35.7 | 83.5 | sl H2O vs EtOH msc eth s ace, bz, chl |
| *the values in superscript refer to the temperature at which the density values were measured | |||||
| Note: Provide references following the style presented in the Reference Style Guide section of this manual. | |||||
Data tables
Unknown # (Identity): (To be noted on the day of the experiment)
| Table 2. Observations taken during the determination of the density of an unknown liquid |
| Trial 1 | Trial 2 | Trial 3 | |||||||
|---|---|---|---|---|---|---|---|---|---|
| Description | Mass flask (g) |
Mass unknown liquid (g) |
Density (g/mL) |
Mass flask (g) |
Mass unknown liquid (g) |
Density (g/mL) |
Mass flask (g) |
Mass unknown liquid (g) |
Density (g/mL) |
| Empty | |||||||||
| + 10,00 mL | |||||||||
| + 20,00 mL | |||||||||
| + 30,00 mL | |||||||||
| + 40,00 mL | |||||||||
| + 50,00 mL | |||||||||
| Temperature of unknown liquid (ºC) | |||||||||
| Average density per trial (g/mL) | |||||||||
| Average density of all 3 trials (g/mL) | |||||||||
| Standard deviation (relative standard deviation) | |||||||||
| Theoretical density value of dichloromethane1 (g/mL) | 1,3266220 | ||||||||
| % error | |||||||||
1. Haynes WM, Lide DR, editors. Physical constants of organic compounds. 94th edition. Boca Raton, Fla.: CRC Press; 2013.
Lab Report
General Information
In this guide, the phrase, "lab report" has a broad meaning, and refers to any document completed after conducting experimental work and submitted to the professor for grading. The lab report may include any one of the following documents:- A formal laboratory report - a lab report, including all, or almost all, of the sections of a lab report presented below (see Sections of a Laboratory Report). The formal lab report is written by the student(s).
- A lab report sheet - a short version of the lab report. This is a fill-in-the-blank type lab report, prepared by the professor and completed by the student(s).
The lab report is due one week after you finish the experimental work in the laboratory, unless otherwise indicated. The lab report sheet may be due at the end of a laboratory session or one week after the experimental work has been completed, unless otherwise indicated. Your professor will provide you with the details and the deadlines for each experiment.
Lab reports will constitute 13% of your total mark for the class.
It is essential that you understand the form and content of the lab report, whether it be a formal lab report or a lab report sheet. The general presentation format of a lab report is described below, as well as a brief description of, and comments on, the various sections of a report. A Sample Lab Report is provided.
Always bear in mind that your report must demonstrate to the professor that you understand the material, and, as such, volume does not represent mastery.
Presentation of a Lab Report |
|
||||||||||||||||||||
| Paper | Use white paper of good quality with standard
dimensions (8.5
by 11 in. or 22 by 28 cm). |
||||||||||||||||||||
| Style | Written by hand or printed, if prepared on the computer. Hand-written lab report sheets must be done with non-erasable
ink. |
||||||||||||||||||||
| Margins | All margins must be set at a value between 2.0 to 2.54 cm. | ||||||||||||||||||||
| Font and font size | Times New Roman 12-point, unless otherwise specified. Other fonts may be used for tables, figures, images, diagrams, etc. | ||||||||||||||||||||
| Spacing | Text must be written using 1.5-line spacing.
However, single line spacing may be used in the following cases:
|
||||||||||||||||||||
| Pagination | Number all pages of a document, except the title page. The page number does not appear on the first page of the document. | ||||||||||||||||||||
| Numbers |
|
||||||||||||||||||||
| Significant figures and units | Always ensure that numbers have the correct units and the correct number of significant figures!! | ||||||||||||||||||||
| Chemical formulas | Ensure that subscripts and superscripts are properly followed. | ||||||||||||||||||||
| Grammatical person |
|
||||||||||||||||||||
| Verb Tense |
|
||||||||||||||||||||
| Plural forms |
|
||||||||||||||||||||
Sections of a Laboratory ReportIn your lab report, provide the sections requested by your professor, in the order presented below. A Sample Lab Report is provided. |
|||||||||||||||||||||
| Use of words like "prove" and "true" | We, as scientists, test hypotheses to support, contradict or refute them. As such, we do not use the words "prove" or "disprove," and we avoid stating that a theory or hypothesis is true untrue, correct or incorrect. These terms reflect a degree of certainty that we, as scientists, do not possess. Remember that in our laboratory sessions we are testing a theory or hypothesis with a procedure that lasts only a few hours, includes only several trials, and uses, at best, only three (3) analytical techniques. This is not enough evidence, scientifically speaking, to claim to know the truth or the existence of a phenomenon. To evaluate your theory or hypothesis, use words like: supported, indicated and suggest when analyzing your results. Your results will "support," "verify," or "confirm" the theory or hypothesis, or they will "negate," "refute," or "contradict" it. In addition, you must defend your claim concerning a theory or hypothesis by demonstrating to the readers that the statement made is based on facts, on verifiable data. The relationship between that data and the conclusions drawn from the data must be explicitly stated to show that the evidence warrants this claim. | ||||||||||||||||||||
| Title, date and name | These need not be on a separate title page for weekly lab reports. However, for comprehensive assessment documents and project documents a title page must be presented. | ||||||||||||||||||||
| Abstract | The purpose of the abstract is to give the reader a
global
view of the work. It is an abbreviated version of the work, written for
people who may never read the complete version, and as such, should be
written to stand on its own. It should contain sufficient information
to allow the reader to determine the nature and scope of the
information provided without having to read the entire work (lab report
in this case). The abstract is a concise and self-contained statement
of the objectives of the experiment, the methods used to obtain the
results, the results obtained, and the conclusions drawn from the
experiment. The abstract is written last to be sure that it accurately
reflects the content of the laboratory report. The professor will
specify the length. Abstracts are written in such a way as to NOT
require figures, tables or images. Thus, figures, tables or images are
not cited in the abstract. References are rarely cited. Only if
absolutely necessary, equations and structures that appear in the
laboratory report may be cited. To write the abstract:
|
||||||||||||||||||||
| Objectives | State the purpose of the experiment. This is generally one or a few points describing what you are trying to show, to do or to find. General and specific objectives should be provided. | ||||||||||||||||||||
| Introduction The maximum length of this section is two (2) pages | This section includes a short discussion (summary) in your own words of the purpose and general theory related to the experiment. What is this experiment all about? Why did you conduct this experiment? Read the appropriate references, make notes of the important points, and then demonstrate your understanding of the relevant theory by presenting it in clear concise grammatically correct English. Pay particular attention to the techniques and instrumentation YOU used in the experiment. Include key concepts, definitions, important equations, and assumptions. You need to show that YOU thoroughly understand the concepts. This need not be taken directly from the lab handouts or the lab manual. It is a good idea to refer to other references as well. | ||||||||||||||||||||
| Results | In general, the Results
section tells the reader what
happened during the experiment and what you observed, the techniques
you used and the values you obtained. Data, results and observations from the analysis of physical properties, chromatographic and spectroscopic data, as well as from other analytical methods will be organized in tables, figures and graphs according to the information provided below.
|
||||||||||||||||||||
| Discussion The maximum length of this section is two (2) pages |
Analysis of Results: State what you obtained and how you obtained it. Comment on the precision of your results. Comment on the accuracy of your results, by comparing your results to the literature or "accepted" value(s) (they can always be found, so search for them!!). Does it/do they agree with accepted theory? Why or why not? From a scientific point of view a "wrong" result (different from what you expected) is very interesting as soon as you try to understand why. If you calculate a value using two different methods, make sure you compare the two answers and methods. What trends did you observe in the data? Remember each time the lab directs you to do something or observe something; there is a reason for it. Ask yourself WHY? Analyze spectroscopic and chromatographic spectra if they form part of the experiment. Answer any questions that appear in the procedure or any asked by your professor. | ||||||||||||||||||||
| Analysis and Conclusion | Summarize your results and relate them to the purpose
of the
experiment.
|
||||||||||||||||||||
| Experimental Errors | A brief description of the major sources of experimental error (random error) is provided. These are errors of the experiment NOT errors made by YOU, the experimenter. In other words, these are not errors due to calibration problems (systematic errors, e.g. the balance was not calibrated properly), or YOUR manipulation limitations (human error, e.g. you misread an instrument or made a calculation error), but are limitations determined by the equipment, or the procedure. They are random or inherent errors mostly due to precision limitations of measuring devices. Try to determine how this error affects your results. That is, are your results over- or under-estimated? | ||||||||||||||||||||
| References | You must always reference all the material you have
used and
referred to in order to gain knowledge and information. This includes
all print and electronic sources, and as well experts in your field
that you may have interviewed. Please refer to the Reference Style Guide for further information about referencing. |
||||||||||||||||||||
Sample Lab Report
Density
Determination of an
Unknown
Liquid
OBJECTIVES
- To determine the density, and thereby the identity, of an unknown liquid by weighing an Erlenmeyer flask before and after the addition of a certain volume of the unknown substance with a volumetric pipet.
RESULTS
Unknown # 8: dichloromethane| Dichloromethane (unknown # 8)
|
Transparent colorless nonviscous liquid with a slight sweet aroma |
| 1,2-dichloroethane
|
Transparent colorless nonviscous liquid with a pleasant smell |
| Note: Provide references following the style presented in the Reference Style Guide section of this manual. | |
Density determination
Experimental conditions: In this space, list the experimental conditions, if applicable. See the Results section of a laboratory report.
| In this table, note observations taken during the experiment in point form. |
|
|
| Trial 1 | Trial 2 | Trial 3 | |||||||
|---|---|---|---|---|---|---|---|---|---|
| Description | Mass flask (g) |
Mass unknown liquid (g) |
Density (g/mL) |
Mass flask (g) |
Mass unknown liquid (g) |
Density (g/mL) |
Mass flask (g) |
Mass unknown liquid (g) |
Density (g/mL) |
| Empty | 52,25 | 51,58 | 51,19 | ||||||
| + 10,00 mL | 65,30 | 13,05 | 1,305 | 64,28 | 12,70 | 1,270 | 66,01 | 14,82 | 1,482 |
| + 20,00 mL | 78,54 | 13,24 | 1,324 | 79,02 | 14,74 | 1,474 | 78,19 | 12,18 | 1,218 |
| + 30,00 mL | 90,56 | 12,02 | 1,202 | 91,02 | 12,00 | 1,200 | 90,10 | 11,91 | 1,191 |
| + 40,00 mL | 106,75 | 16,19 | 1,619 | 106,39 | 15,37 | 1,537 | 107,20 | 17,10 | 1,710 |
| + 50,00 mL | 118,03 | 11,28 | 1,128 | 118,21 | 11,82 | 1,182 | 117,68 | 10.48 | 1,048 |
| Temperature of unknown liquid (ºC) | 23,0 | 23,0 | 23,0 | ||||||
| Average density per trial* (g/mL) | 1,31623 | 1,33323 | 1,33023 | ||||||
| Average density of all 3 trials* (g/mL) | 1,32623 | ||||||||
| Standard deviation (relative standard deviation) | 0,0091 (0,687 %) | ||||||||
| Theoretical density1 value of dichloromethane* (g/mL) | 1,3266220 | ||||||||
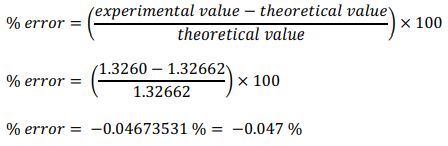
| % error | -0.047 % | ||||||||
|
*the
values in
superscript refer to the
temperature at which the density values were measured
|
|||||||||
Sample Calculations:
Density
Density = mass / volume = (65.30 g - 52.25 g) / 10.00 mL = 1.305 g/mL
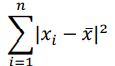
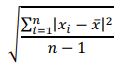
Standard deviation and relative standard deviation (%)



| Deviation from the mean | Deviations from the mean squared | Sum of the squares of the deviations from the mean | Standard deviation (sx) | Relative standard deviation (%) |
|---|---|---|---|---|
 |
 |
 |
 |
|
| /1,3156 - 1,3260/= | 0,01042 = 0,00010816 | 0,00016616 | 0,009114823 = 0,0091 (4 places after the decimal = 2 significant figures) |
0,68739239 = 0,687% |
| /1,3326 - 1,3260/= | 0,00662 = 0,00004356 | |||
| /1,3298 - 1,3260/= | 0,00382 = 0,00001444 | |||
| The standard deviation is always written to one more decimal place than the mean value | Percentages may be expressed with 2 or 3 significant figures |

Percentage error
DISCUSSION
Properties of matter can be divided into
intensive
and
extensive
properties.2 Intensive properties are those
independent of
sample size and extensive are dependent upon sample size. Density,
pressure, and temperature are examples of the former, while volume and
mass are examples of the latter. Density can be obtained from
measurements of the extensive properties, mass and volume, as it is
defined as mass per unit volume. Density, while now independent of
sample size is, however, not independent of the other intensive
properties, pressure and temperature. If the pressure on the sample
increases, then so does the density. If the temperature increases, then
in most cases the density will decrease. Thus, for most substances,
densities increase from gas to liquid to solid. A very notable
exception is water below 4ºC.2 Liquid water has
a maximum
density of 1.000 g/mL at 4ºC.1 However, as the
temperature
decreases, water"s density also decreases. It is, thus, one of very
few substances in which the solid has a lower density (0.9167 g/mL1)
than the liquid (1.000 g/mL at 4ºC).
In this experiment, the density of unknown # 8 (dichloromethane) was
determined by weighing an Erlenmeyer flask before and after the
addition of a certain volume of dichloromethane with a volumetric
pipet. Three trials were conducted, yielding density values that ranged
from 1.048 g/mL to 1.710 g/mL at 23.0ºC and 757.4 mmHg. The average
density values for each trial were determined to be: trial 1, 1.316;
trail 2, 1.333; and trial 3, 1.330 g/mL. Thus the overall average
density of dichloromethane of three (3) trials was 1.326 ± 0.0091
(0.687 %) g/mL.
Standard deviation is a measure of the precision of the results.2
Thus, given that the value of the standard deviation obtained was small
(0.0091 or 0.687 % g/mL), the results were precise. In view of the
reproducibility with different sample size, density would appear to be
an intensive property. The overall average density of dichloromethane
agrees extremely well with the literature value for the density of
dichloromethane (1.32662 g/mL1), therefore the
results were
also very accurate (% error = -0.047 %). The excellent agreement
between the literature and experimental values for the density of
dichloromethane also suggest that the unknown liquid was indeed
dichloromethane. Further evidence that the unknown was an organic
compound containing chlorine or bromine, is provided by the fact that
it was a liquid at room temperature, it appeared to be quite volatile
and it had a density above 1.00 g/mL.
CONCLUSION
The density of unknown # 8 (dichloromethane) was determined by successive additions of the unknown liquid to an Erlenmeyer flask, and subsequent weighing. After conducting three trials, the average density of dichloromethane was calculated to be 1.326 ± 0.0091 (0.687 %) g/mL at 23.0°C and 757.4 mmHg. The very small standard deviation (0.0091 or 0.687 %) indicates that the results were precise. The excellent accuracy (% error = -0.047 %) of the experimental value compared to the theoretical value (1.32662 g/mL) suggests that the unknown was dichloromethane. Dichloromethane is a transparent colorless liquid at 23.0°C and 757.4 mmHg with a slight sweet aroma. Given the excellent accuracy and precision of the results, dichloromethane seems to be very pure. This technique is, thus, an excellent one to determine the density of a liquid. However, the use of a pycnometer3 would allow one to determine the density with even greater accuracy, that is, to five significant figures.
ERRORS
The main source of error may be the measurement of the volume of the unknown with the volumetric pipet. As volumetric pipets are calibrated for water, it is presumptuous to assume they will deliver the correct volume in this experiment. It would require the use of pycnometer or volumetric flask, at the temperature for which it was calibrated, to give an accurate volume.
REFERENCES
Note: Use the National Library of Medicine Style on the zoterobib site.- Haynes WM, Lide DR, editors. Physical constants of organic compounds. 94th ed. Boca Raton, Fla.: CRC Press; 2013.
- Brown TL, LeMay HE Jr, Bursten BE, Murphy CJ, Woodward PM, Stoltzfus MW. Chemistry: The central science. 13th edition. Boston: Pearson; 2015.
- Pratten NA. The precise measurement of the density of small samples. Journal of Materials Science. 1981;17(7):1737.
Flow Diagram
General Information
A flow diagram (scheme or chart) is a very visual representation of a procedure as it shows the different steps and/or manipulations as well as their correct order. Its purpose is, therefore, to help you understand how and why each step in a procedure is performed. A flow diagram is often used in the following situations:- Synthesis: To show the step-by-step synthesis of a substance. In a synthesis experiment, a flow diagram includes all important reactions and indicates where unwanted side products and excess or unreacted starting materials are separated from the desired product.
- Purification: To show how a substance is purified. Common techniques used to help isolate and purify an organic compound include extraction, recrystallization, gravity filtration, hot gravity filtration, vacuum filtration, distillation, and steam distillation. The organic chemist commonly uses two types of extractions: Solid-liquid extraction and liquid-liquid extraction. During a solid-liquid extraction, the solvent (liquid), in contact with the solid, dissolves the substances that are soluble in it. In this case, the flow diagram indicates the substances that are soluble in the solvent and those that remain in the solid (if known). The preparation of tea and coffee using hot water are examples of this type of extraction. A liquid-liquid extraction separates components of a mixture based on the preferential solubility of each component in the organic and the aqueous solvents. The flow diagram indicates compounds that are water soluble, and, thus, are found in the aqueous layer, as well as compounds found in the organic layer because of their solubility in organic solvents. In all cases, the flow diagram includes all important reactions, including acid-base reactions.
- Analysis techniques: To show how a substance is analyzed when performing a qualitative chemical test or when determining the solubility of a substance in different solvents (see Figure 1 below: Flow diagram of the procedure for testing the solubility of a solute in a room temperature solvent).
Drawing a Flow Diagram
As you construct the flow diagram, ask yourself why each step is being performed and why each specific technique is being used. You must know the structure and physical properties of the reactants or compounds present, as well as of the products and/or by-products of all reactions. During extractions, in order to help determine which components are present in the aqueous or organic layer, it may help to ask yourself, "Have I converted a non-ionic substance to an ionic one?" The ionic substances will be in the aqueous layer, the non-ionic ones in the organic layer.
Important points about a flow diagram:
- In the boxes indicate all important:
- Substances, solutions, phases (aqueous and organic) or mixtures AND their contents (ex. crude caffeine crystals contain: caffeine and impurities such as chlorophyll)
- Results and/or conclusions (ex. soluble, poor recrystallization solvent, etc.)
- On the arrows - include the important manipulations and techniques
- Indicate:
- Substances, solutions, phases or mixtures to discard
- Separations of solids from liquids
- Separations of aqueous phases from organic phases
- Include all important reactions
Example of a Flow Diagram
As an example, we will construct a flow diagram for testing the solubility of a solute in a solvent. The procedure is as follows:
"The solubility of two solutes in three solvents will be determined. The solutes you will test are: Anthracene and acetaminophen. The three solvents you will use are: Hexane, acetone and water. To avoid cross contaminating your samples, be sure that your spatula and dropper are clean before moving on to another solute. Obtain six (6) test tubes and label them appropriately. To test the solubility of each solid, transfer about 10 mg into the labeled test tube. An amount that forms a symmetrical mound of about 4-5 mm in diameter on the end of a spatula is a good estimate of 10 mg. Add about 500 µL of room temperature solvent using a calibrated dropper and mix the contents. To mix the contents, either flick the end of the reaction tube with your finger or use a vortex. If any lumps remain after the contents have been mixed several times, use a glass-stirring rod to break them up. Observe. Note the degree of solubility of the solute (i.e. soluble, insoluble or slightly soluble).Given this procedure the flow diagram below may be prepared (Figure 1).
If the substance is readily soluble in the room temperature solvent, this solvent is not a good recrystallization solvent. Why? If the substance fails to completely dissolve in a given solvent at room temperature, add an additional 250 µL of solvent. You may add additional solvent to a total maximum volume of 1500 µL only. It is very important at the step to not add too much solvent, because adding too much solvent will hinder the crystallization of the solute when the mixture is heated and then is cooled. Note the degree of solubility of the solute (i.e. soluble, insoluble or slightly soluble) in the additional room temperature solvent. If the substance is now soluble in the additional room temperature solvent, this solvent is not a good recrystallization solvent. On the other hand, if the substance has still not completely dissolved in the solvent, its solubility must be tested in hot solvent."

Reference Style Guide
Introduction
Scientific writing, by nature, requires that we use the words and ideas of another. We are obliged to indicate exactly the source of our information and ideas. In other words, we must document or reference our sources. Thus, documenting or referencing is a standardized way of acknowledging the sources of information and ideas in scientific documents of the following type: lab reports, research papers, honors projects, theses and journal articles. There is a very specific format that is used to reference, and this documentation style (reference style) depends on the discipline (e.g. science, human sciences, and arts). It is very important to be consistent and follow a specific style when you reference as well as verify the credibility of the sources of information used (see Verifying the credibility of sources).Why Reference?
We reference for the following reasons:
- To acknowledge that certain information and ideas have already been presented by another person
- To identify the source of the information, so that the reader may locate your sources for further information, clarification or verification
- To identify the source of your inspirations
- To avoid plagiarism (see Appendix 2: Plagiarism)
- To respect intellectual property rights (copyright, patent, trademark, etc.)
When to Reference?
You must reference all information and ideas from an author, including but not limited to:
- Work consulted for inspiration or to gain knowledge of a particular topic
- Ideas, concepts, theories presented in the words of the author (quote) or in your own words (paraphrase)
- Charts, figures, images, graphs, etc.
Reference Styles
Each discipline has its own reference or documentation style. For example, the American Psychological Association (APA) and the Modern Language Association (MLA) reference styles are generally used in the humanities, behavioral and social sciences. In the sciences, almost every field of science has its own reference style. You must respect the reference style chosen by the professor of the specific course.
Chemistry courses will use the United States National Library of Medicine (NLM) Style Guide (Citing Medicine: The NLM Style Guide for Authors, Editors, and Publishers) that is popular in medicine and biomedical sciences. In this style, a superscripted number (author-number system or Vancouver system) is used in the text (in-text citation) to indicate the source, and these numbers refer to the reference list at the end of the document presented in the National Library of Medicine style (see National Library of Medicine Style below).
Verifying the Credibility of Sources
- Each source must be evaluated to determine if it is reliable.
- To verify your sources, ask the
following
questions:
- Who is the author of the document/information? Who is publishing this information?
- What establishes the credibility of the author (his education, experience, position)?
- What establishes the credibility of the website and the information found therein?
- When was the information published? Is the source up to date?
- Does the author cite his sources?
- Could the source be biased? Does the source consider all viewpoints? For example, companies that sell goods/services may provide biased information to get people to buy their products.
National Library of Medicine (NLM) Style
This style of referencing uses in-text citations in the form of superscripted numbers, as well as a reference list at the end of the document.
- In-text citations
- Place a superscripted number (author-number citation system or Vancouver system) within the document to indicate the source.
- Start numbering at one (1) and progressively increases as new sources are cited. Each intext citation number refers to its number in the bibliographic (reference) list presented at the end of the document. This list provides the complete bibliographic details of each source.
- Reference list
- Use the online bibliographic generator called zoterobib (see the section below zoterobib) to generate a numerical list of references that follow the bibliographic style of the National Library of Medicine (NLM).
- Present this bibliographic list at the end of the document in a separate section entitled References. This list includes all the sources cited in the document, in the same order that they have been cited in the text.
In-Text Citations
| General Information |
|
| Format |
|
| Punctation |
|
| Reference List |
|
zoterobib - online bibliographic generator
Introduction
- Use the online tool called zoterobib to generate a reference list.
- Note: In general,
using zoterobib
I
found it difficult
to find sources using the title and author of the document. You will
find some easier methods to find sources described in the sections
below:
- Books - print and online
- Part of a book - print and online
- Periodicals (journals, magazines) and newspapers - print and online
- Web pages
- Videos
To setup zoterobib
- Go to zoterobib.
- In the Cite field, enter an ISBN number
of the
book, a URL
link
of the internet site, a DOI number of the article or a title.
For example:
- Haynes, Handbook of Chemistry and Physics, 94th edition
- Graham Solomons Organic Chemistry
- Structures nomenclature réactions chimie organique
- Click Cite.
- In the list that appears, select the citation that corresponds to the source you are looking for
- The source now appears in the bibliography section
- In the dark blue bar under the bibliography title, click the down arrow and select 9700+ other styles available.
- In the search field, enter National Library of Medicine and select it from the list.
- Click Add.
- In the bibliographic list further down on the page, your source now appears in the National Library of Medicine format.
- The following pages present a detailed
description of how
to use zoterobib
to cite:
- Books - print and online
- Part of a book - print and online
- Periodicals (journals, magazines) and newspapers - print and online
- Web pages
- Videos
- You may create your full bibliographic list using zoterobib.
- Once complete, go to the bottom of the page. Under Export click Copy to clipboard and paste the list into your document.
Books, Science and Technical Reports - Print and Online
- Find the 13-digit ISBN number of the book. To find the ISBN number, search through the first few pages of the book or find the book on Amazon or the publishers home page. The ISBN number will be listed on the web page.
- Enter the book ISBN in the Cite
field
on zoterobib.
- Note: For online books, you may try to copy the URL and paste it into the Cite field. However, if this does not give you the correct book, you will have to use the book ISBN or enter the bibliographic information manually.
- Click Cite.
- The book appears in the shaded blue area below the Cite field.
- Make sure that the reference contains to
the
information
in the
list below. If not, you will have to find the information and enter it
manually. It is important to note that a credible reference must have
this information (see the section Verifying
the
credibility of sources above).
- Title
- Authors
- Edition (if necessary)
- Place of publication
- Publisher
- Date
- URL (for online books)
- Accessed (for online books)
- To add or change any information, click on Edit. A new window opens with many fields, some of which are already populated.
- When finished, click Done.
- The main page reappears. In the bibliographic list further down on the page, your source now appears in the National Library of Medicine format.
- You may continue to build the bibliographic library in zoterobib.
- Once complete, under Export (further down on the page), click Copy to clipboard and paste the list into your document.
Examples
Print Books
Solomons TWG, Fryhle CB, Snyder SA. Organic chemistry. 12th Edition. Hoboken, NJ: Wiley; 2016.
Haynes WM, Lide DR, editors. CRC handbook of chemistry and physics. 94th ed. Boca Raton, Fla.: CRC Press; 2013.
Online books
Sarin A. Biodiesel: Production and Properties [Internet]. Cambridge, UK: Royal Society of Chemistry; 2012. 281 p. Available from: https://books.google.ca/books?id=72klFb2goSUC&pg=PA63&source=gbs_selected_pages&cad=2#v=onepage&q&f=false
Scientific or technical reports
Trowbridge DT, Mastropierro JT, Zubler MT. Certificate of calibration, Cannon-Fenske routine viscometer [Internet]. State College, PA: Cannon Instrument Co.; 2011. Available from:http://web.cegepgim.ca/chimiepetrachemistry/OrganicChemistry2/Biodiesel/Procedure/ViscosityCannonCertificateOfCalibration.pdf
Part of a Book, Science or Technical Report - Print and Online
- Find the 13-digit ISBN number of the book. To find the ISBN number, search through the first few pages of the book or find the book on Amazon or the publishers home page. The ISBN number will be listed on the web page.
- Enter the book ISBN in the Cite
field
on zoterobib.
Note: For online books, you may try to copy the URL and paste it into the Cite field. However, if this does not give you the correct book, you will have to use the book ISBN or enter the bibliographic information manually.
- Click Cite.
- The book appears in the shaded blue area below the Cite field.
- Click on Edit. A new window opens with many fields, some of which are already populated.
- In the Item Type field, select Book section.
- Copy the name of the book from the Title field and paste it into the Book title field below the authors.
- Now, in the Title field you may enter the section of the book you wish to cite (e.g. the chapter number and title: Chapter 23 Lipids).
- Make sure that the reference contains
the
information in
the
list below. If not, you will have to find the information and enter it
manually. It is important to note that a credible reference must have
this information (see the section Verifying
the
credibility of sources above).
- Title
- Authors
- Edition (if necessary)
- Place of publication
- Publisher
- Date
- URL (for online books)
- Accessed (for online books)
- . When finished, click Done.
- The main page reappears. In the bibliographic list further down on the page, your source now appears in the National Library of Medicine format.
- You may continue to build the bibliographic library in zoterobib.
- Once complete, under Export (further down on the page), click Copy to clipboard and paste the list into your document
Examples
Section of a print book
Solomons TWG, Fryhle CB, Snyder SA. Chapter 23 Lipids. In: Organic Chemistry, 12th edition. Hoboken, New Jersey: John Wiley & Sons, Inc; 2016.
Haynes WM, Lide DR, editors. Physical constants of organic compounds. In: CRC handbook of chemistry and physics: a readyreference book of chemical and physical data. 94. ed. Boca Raton, Fla.: CRC Press; 2013.
Section of an online book
Sarin A. Chapter 3 Biodiesel properties and specifications. In: Biodiesel: Production and Properties [Internet]. Cambridge, UK: Royal Society of Chemistry; 2012. Available from: https://books.google.ca/books?id=72klFb2goSUC&pg=PA63&source=gbs_selected_pages&cad=2#v=onepage&q&f=false
Periodicals (Journals, Magazines) and Newspapers - Print and Online
Journal article (e.g. Journal of Chemical Education)
- Find the DOI (digital object identifier)
number
of the
journal
article in:
- Article itself
- Google Scholar
- Journal of Chemical Education
- Enter the DOI number in the Cite field on zoterobib.
- Click Cite.
- The periodical appears in the shaded blue area below the Cite field.
- Click on Edit>. A new window opens with many fields, some of which are already populated.
- In the Item Type field,
select the
appropriate item
according to the type of periodical:
- For a journal article, select Journal article
- For a newspaper article, select Newspaper article
- For a magazine article, select Magazine article
- Make sure that the reference contains
the
information in
the
list below according to article type. If not, you will have to find the
information and enter it manually. It is important to note that a
credible reference must have this information (see the section Verifying
the
credibility of sources above).
Journal article Newspaper article Magazine article - Title
- Authors
- Publication - Journal name
- Volume
- Pages
- Date
- Title
- Authors
- Publication - Newspaper name
- Date
- URL (for online sources)
- Accessed
- Title
- Authors
- Publication - Magazine name
- Date
- URL (for online sources)
- Accessed
- When finished, click Done.
- The main page reappears. In the bibliographic list further down on the page, your source now appears in the National Library of Medicine format.
- You may continue to build the bibliographic library in zoterobib.
- Once complete, under Export (further down on the page), click Copy to clipboard and paste the list into your document.
Newspaper or magazine article
- Copy the URL of the newspaper or magazine.
- Paste the URL into the Cite field on zoterobib.
Examples
Journal article
Clarke NR, Casey JP, Brown ED, Oneyma E, Donaghy KJ. Preparation and Viscosity of Biodiesel from New and Used Vegetable Oil. An Inquiry-Based Environmental Chemistry Laboratory. J Chem Educ. 2006 Feb;83(2):257.
Newspaper article
Authier P. Quebec will move medical staff to Montreal's coronavirus battlefront. Montreal Gazette [Internet]. [cited 2020 Apr 20]; Available from: https://montrealgazette.com/news/quebec/hospitals-put-on-slowdown-doctors-redirected-to-covid-19-front-lines-chslds
Magazine article
Treble P. Coronavirus in Canada: These charts show how our fight to "œflatten the curve" is going - Macleans.ca. Maclean's [Internet]. 2020 [cited 2020 Apr 20]; Available from: https://www.macleans.ca/society/health/coronavirus-in-canada-these-charts-show-how-our-fight-to-flatten-the-curve-is-going/
Web Sites and Pages
- Copy the URL of the web page and paste it into the Cite field on zoterobib.
- Click Cite.
- The web page appears in the shaded blue area below the Cite field.
- Click on Edit. A new window opens with many fields, some of which are already populated.
- Make sure that the reference contains
the
information in
the
list below. If not, you will have to find the information and enter it
manually. It is important to note that a credible reference must have
this information (see the section Verifying
the
credibility of sources above).
Web sites Web pages - Authors
- Title of web site
- Publisher
- Date
- Date accessed
- URL
- Authors
- Title of web page
- Title of web site
- Publisher
- Date
- Date accessed
- UR
- When finished, click Done.
- The main page reappears. In the bibliographic list further down on the page, your source now appears in the National Library of Medicine format.
- You may continue to build the bibliographic library in zoterobib.
- Once complete, under Export (further down on the page), click Copy to clipboard and paste the list into your document.
Examples
Website: Collection of web pages that are linked together. One website may have many web pages, e.g. Health Canada
Zotero. ZoteroBib [Internet]. Zotero; 2025 [cité le 21 avr. 2025]. Disponible sur : https://zbib.org/
Web page: A specific page of a website
National Biodiesel Education Program. Triglyceride Molecular Weight Calculator [Internet]. Biodiesel Education Program. University of Idaho; 2019 [cited 2020 Apr 17]. Available from: http://biodieseleducation.org/index.html
Videos
- Copy the URL of the video and paste it into the Cite field on zoterobib.
- Click Cite.
- The video appears in the shaded blue area below the Cite field.
- Click on Edit. A new window opens with many fields, some of which are already populated.
- In the Item Type field, select Video Recording.
- Make sure that the reference contains to
the
information
in the
list below. If not, you will have to find the information and enter it
manually. It is important to note that a credible reference must have
this information (see the section Verifying
the
credibility of sources above).
- Title (of the video)
- Directors (authors)
- Studio (YouTube or other)
- Date
- URL
- Accessed
- When finished, click Done.
- The main page reappears. In the bibliographic list further down on the page, your source now appears in the National Library of Medicine format.
- You may continue to build the bibliographic library in zoterobib.
- Once complete, under Export (further down on the page), click Copy to clipboard and paste the list into your document.
Examples
Cormier K. Filtration sous vide [Internet]. YouTube; 2014 [cited 2020 Apr 21]. Available from: https://www.youtube.com/watch?v=1cFcCIuCbL8
ChemSurvival. Introduction to Recrystallization [Internet]. YouTube. 2012 [cited 2020 Apr 21]. Available from: https://www.youtube.com/watch?v=htTvL4JhscM&list=PLAhRiX8pHhMLvkECEEmqF8jCbmoNYq7v_&index=2
Appendix 1: Laboratory Measurement and Uncertainty
Measurement by its very nature has limitations, which must be appreciated by anyone making them or using them. Any quantity capable of existing in a continuous manner can never be measured exactly.
Some uncertainty is associated with any measurement. To be completely specific on any item of data, one must estimate the accuracy of measurement. The general rule of thumb is that the uncertainty in any measurement is 1/2 the smallest graduation. For example, if the length of some object is between 25.5 cm and 25.6 cm, it would be reported as 25.55 ± 0.05 cm. Normally you can be fairly certain the actual value lies in this range.
When measured quantities are used to calculate another quantity, uncertainty in the measurements introduces uncertainty in the calculated result. When the uncertainty in each measured quantity has been estimated, the uncertainty in the result can be obtained by the following rules. The point to remember is that your final answer must reflect the uncertainty in your measurements.
- The uncertainty in a sum or difference
is the sum
of the
uncertainty in the individual terms. For example:
- Weight of flask A 16.7321 ± 0.0005 g
- Weight of flask B 16.84 ± 0.05 g
- Total 33.5721 ± 0.0505 g
-
When the measurements are multiplied or divided to obtain the desired quantity, the percentage uncertainty, not the uncertainty, is added.
EXAMPLE- Mass of block = 5.324 ± 0.005g
- % uncertainty = (0.005 / 5.324)*100 = 0.09391%
- Volume of block = 7.1 ± 0.5 mL
- % uncertainty = (0.5 / 7.1)*100 = 7.00%
- Hence the density = 5.324 / 7.1 = 0.7499 g/mL = 0.75 g/mL (2 sigfigs)
- % uncertainty = 7.0% + 0.09391% = 7.09391 %
- Therefore, the uncertainty in density is 0.0709391 x 0.7499 g/mL = 0.053 g/mL.
Again, we write the value to reflect the uncertainty, i.e. density = 0.75 ± 0.05 g/mL. Notice it is the volume that determines the uncertainty in the density (i.e. the value with the largest % uncertainty determines the % uncertainty in the calculated value).
Rather than having to calculate uncertainty or % uncertainty for each measured quantity and then sum them as above, it is common to use the concept of significant figures to ensure that a calculated value is shown with the correct degree of uncertainty. In most cases significant figures will give the correct degree of uncertainty.
The number of significant figures is defined as the number of digits not used for placing the decimal marker and ones we know something about. For example: Number Significant Figures
| Number | Significant Figures |
| 124.3 | 4 |
| 1.24 | 3 |
| 1.2 | 2 |
| 0.12 | 2 |
| 0.012 | 2 |
| 0.0120 | 3 (better to write as 1.20 x 10⁻² then there is no doubt) |
As the number of significant figures increases, the % uncertainty decreases.
EXAMPLE
- % uncertainty in 124.3 = (0.5 / 124.3)*100 = 0.402%
- % uncertainty in 1.24 = (0.05 / 1.24)*100 = 4.00%
- % uncertainty in 31 = (5 / 31)*100 = 16.1%
To a first approximation, two numbers with the same number of significant figures have the same uncertainty. As was shown previously, the datum with the largest percentage uncertainty determines the uncertainty in the calculated quantity. Thus, the rule of thumb is that the calculated number has the same number of significant figures as the datum with the smallest number of significant figures. However, it is necessary to be careful with numbers like 9.8 and 10.1. They have different numbers of significant figures but the same % uncertainty so this rule of thumb must be used judiciously. In fact, at this stage of your chemistry career it is useful to observe that three (3) significant figures is the norm for most laboratory experiments and problems except in titrations where you will find four (4). Any ideas why?
CENTRAL TENDENCYGenerally, you will find that all measurements in scientific work are taken a number of times. The rational for this repetition has been formalized by a branch of mathematics called statistics. Most sets of measurements will approximate a normal or Gaussian distribution if the errors are random in nature. The arithmetic mean (average) of a finite set of measurements is the best approximation of the most probable value (the peak of the curve)
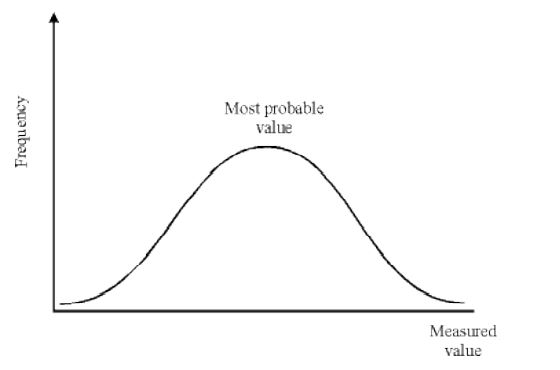
The validity of the approximation depends upon the precision (or mutual agreement) of the measurements. If there is close agreement between the measurements, then you can have confidence that the average is the best that can be obtained from the experimental procedure.
ACCURACYAccuracy refers to the agreement between measurement and the "true" or accepted value based upon the best experimental technique. People commonly assume that precise results are also accurate results. While precise results are required for accurate ones, there is no guarantee they will be accurate. A systematic error can make the most precise results worthless. Thus, it is important to design out systematic errors in experimental procedures.
Appendix 2: Plagiarism
This appendix includes a document describing plagiarism that was published by the University of Ottawa. Students must read and become completely familiar with this document. The document can be found by clicking here.