Determination of iron in various food and environmental samples
(revised 3 March 2026)
Introduction
Importance of iron in the human body
Iron is one of many minerals required by the human body to function
correctly. Iron is necessary for the transport of oxygen in the blood by
hemoglobin, for the storage of oxygen in the muscle cells by myoglobin, as well
as for many other important metabolic processes which include the
production of red blood cells, the supply of energy by the cytochromes
in the electron transport system, and for deoxyribonucleic acid (DNA)
synthesis.1 Hemoglobin and myoglobin are oxygen-carrying
proteins found in the blood and muscle tissue, respectively,
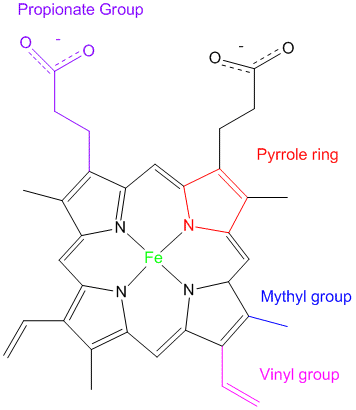
containing heme groups that bind the oxygen molecule. Each heme
group is composed of a photoporphyrin IX ring
with an iron (Fe2+) atom at its center (see Figure 1 below).2
Figure 1. Structure of heme consisting of the photoporphyrin IX ring with a bound iron atom in its ferrous (2+) state.2
In
the lungs, the iron atom in the heme group of hemoglobin binds molecular oxygen
(O2) and carries it to the cells of the body (e.g., muscle
cells) so that they may carry out their normal functions. Thus, the role
of iron in the heme group is vitally important, because, without it, oxygen
would not bind to hemoglobin, and the cells of the body would not receive the
oxygen they need to carry out their processes. In short, the cells
would die due to lack of oxygen.1 Iron deficiency leaves a
person feeling tired, dizzy, and listless, and is the most common
cause of chronic anemia.2 Iron, being essential for life,
is found in many of the foods we eat. It is particularly abundant in red
meat, and in smaller quantities in grains and vegetables.2
Experimental objectives
To determine the amount of
iron in a food or environmental sample (e.g. seaweed, broccoli, spinach, cereal), first the iron is extracted
from the sample using the technique of dry
ashing. Following this, you will determine the concentration of iron in your sample by spectrophotometry
(also known as ultraviolet-visible spectroscopy, or UV-Vis
spectroscopy) using the procedure you have determined for your prelab (see Prelab section below).
Extraction and analysis of iron
During the ashing procedure, iron in the ferrous (Fe2+) state in the sample is converted
into the ferric (Fe3+) form by heating the sample over a Bunsen burner to a
fine ash.3The
sample is ashed (burned or charred) to oxidize the iron contained
within, ensuring that the extracted iron is in the ferric form.
Hydrochloric acid is then added to the ashed sample to extract the iron
from the ash in the form of a Fe3+(aq) ions, and the sample is filtered by gravity filtration. The filtrate is collected. This filtrate will be referred to as the original sample filtrate. As well, it is important to add hydrochloric acid to the sample to ensure that a solid precipitate of Fe(OH)2+ does not form through the process of hydrolysis. To determine the amount of Fe3+ in the sample, you will then follow the procedure you have presented in your prelab.
Ultraviolet-Visible (UV-Vis) spectrophotometry and Beer's law
You may find the video below about UV-Visible spectroscopy helpful.4
Theoretical and manufacturer's values for the amount of Fe3+ the seaweed samples
Zostera marina L. (eelgrass) is 183 µg Fe3+/g sample dry weight before ashing5
Dulse 360 µg Fe3+/g sample dry weight before ashing (calculated from package)6
To find the scientific articles (minimum of two (2) that use the correct detection method)
To find a procedure to determine the concentration of iron in
your sample, the following list provides some
important information:
Search the Journal of Chemical Education
and other online or print sources to find scholarly articles that
present methods to analyze the amount of iron in ashing extracts by
spectrophotometry (also known as ultraviolet-visible spectroscopy or
UV-Vis spectroscopy). Standard spectrophotometric laboratory techniques
exist to determine iron content in solutions. You must find two (2)
credible sources that use your chosen method. Note that you will only
have access to the PDF versions of the articles in the Journal of
Chemical EducationONLYif logged in to the network at the Cégep (it will not work in the residence or at home).
The method must detect from 10 to 80 µM Fe3+. The total volume of the solutions must be no greater than 15 mL.
You have at your disposal the following solutions:
Solution of FeCl3 or Fe(NO3)3
Solution of HCl
Solution of KSCN
Verify with your professor before continuingwith the completion the different sections of the prelab (instructions are given below).
Safety
Pipet all solutions using a pipetting aid. Remember all solutions contain HCl. It can cause burns. Clean all spills and wash your hands with lots of H2O if you spill any HClon them. Wear your safety glasses.
Procedure
Part 1. Ashing
Obtain
the mass of a dry crucible with its lid. Add as much of your
chosen sample (broccoli, spinach or seaweed) to the crucible as
possible. The mass should not exceed 5 g). Reweigh. Heat
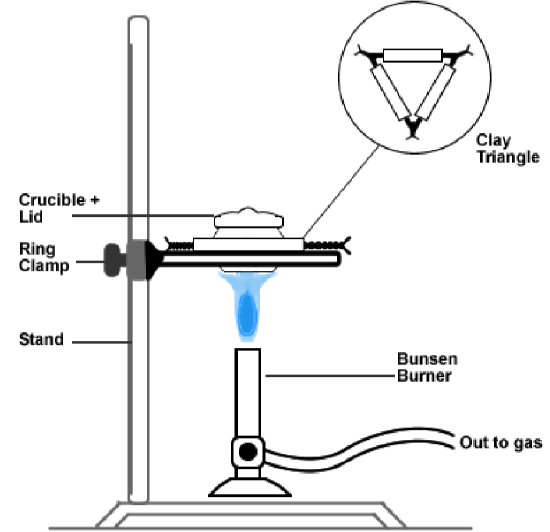
the sample over a Bunsen
burner as shown in Figure 2 below. Make sure the sample is heated
to a fine grey ash. Cool the sample and weigh the ash. Transfer
the ash to a clean beaker. Add
approximately 10.00 mL of 2.0 M HCl with a pipet.
Stir gently, by swirling the beaker for about 5 minutes. Filter
the mixture by gravity filtration through a very small filter paper into a 10 mL graduated cylinder. Gently squeeze the filter paper to obtain the maximum amount of
filtrate. Be careful to not break the filter paper. Note the final volume. Keep this filtrate.
Henceforth, it will be referred to as the original sample filtrate. If necessary, repeat for the second sample.
Figure 2. Ashing setup with a crucible and bunsen burner.
Prelab for Part 1. Ashing
Prepare tables
for the experimental results for the ashing of the seaweed procedure given above.
Part 2. Analysis of Fe3+ in the original sample filtrate - preparation of the calibration curve
Prelab
Provide a list of laboratory equipment and solutions.
Provide the reaction used for detection.
Provide a procedure.
In other words, describe how you will prepare the calibration
solutions, measure the absorbance of these solutions, and construct the
calibration curve.
Prepare tables for the experimental results. One such table must contain the solution number, the all of the different solutions that
must be pipetted and the volume of each to pipet, as well as the total volume. Also include in the
table, the final Fe3+ concentration of each solution. Provide your
calculations.
Provide your sources at the end of the prelab in the References section. Do not forget to cite your sources using the NLM style.
You
will then follow this procedure that you have developed when performing
the experiment in the lab. Include all modifications suggested by the
professor. Part 3. Determination the amount of Fe3+ in the original sample filtrate (ashed sample)
Prelab
Provide a stepwise procedure.
Prepare tables for the experimental results.
Write
a stepwise procedure to determine the amount of Fe3+ in the
original sample filtrate (see ashing procedure below) by
spectrophotometry.
Describe how do you plan to use the results that you obtaine to determine the amount
of Fe3+ in your original sample. Will you create a graph, table,
etc. What calculations will you perform? The amount of Fe3+ in your
sample must be expressed in µg Fe3+/g sample dry weight before ashing, as well as in percentage of Fe3+ extracted from the sample dry weight before ashing.
How will you compare your value with the manufacturer's or theoretical value?
Provide your sources in the References section. Do not forget to cite your sources using the NLM style.
You
will then follow this procedure that you have developed when performing
the experiment in the lab. Include all modifications suggested by the
professor.
References
Devlin
TM. Textbook of Biochemistry with Clinical Correlations, 6th edition. Hoboken,
NJ: Wiley-Liss; c2006. Chapter 21, Iron and Heme Metabolism; p. 823
Katzung BG, Masters SB, Trevor AJ. Basic and Clinical
Pharmacology, 11th edition. Toronto; The McGraw-Hill Companies, Inc. c2009.
Chapter 33, Agents used in anemias; hematopoietic growth factors; p. 569
Jackson
PJ. The determination of ferrous iron in pulverized fuel ash and slags
from pulverized fuel-fired boilers. J App. Chem. 1957.
Professor Davis, ChemSurvival. How a simple UV-Visible spectrophotometer
works [Internet]. YouTube; 2014 [cited 16 Feb 2023]. Available from: https://www.youtube.com/watch?v=wxrAELeXlek
Gaeckle
J, Extent and magnitude of nutrient and contaminant concentrations in
eelgrass (Zostera marina L.) in Puget Sound. Olympia, Washington:
Washington State Department of Natural Resources; 30 March 2016