Studying the kinetics of a reaction means an investigation of the rate of a reaction. Several factors can
influence the rate of a chemical reaction: temperature, nature and
concentration of reactants, surface area and the presence of a catalyst. By
studying the variation in the concentration of reactants
over the course of a reaction, it is possible to determine its rate law. This
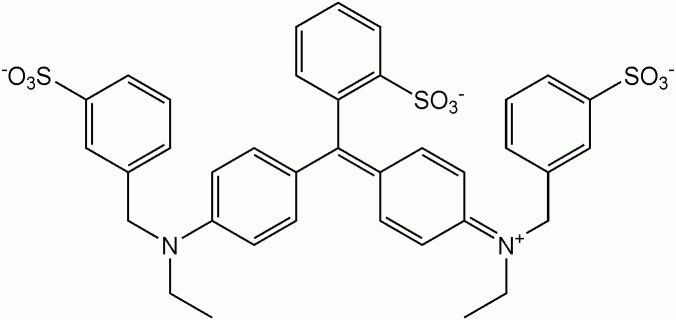
experiment will focus on the decomposition of a Brilliant Blue food colorant (Brilliant
Blue FCF, shown below) in the presence of bleach, whose active
ingredient is sodium hypochlorite.
Since several products are obtained in this
reaction, the general reaction will be written in the following way:
Blue (aq) +
NaOCl (aq) products (aq)
(equation 1)
Thus, the rate law of this reaction is given by the following expression:
rate = k [Blue]m [NaOCl]n (equation 2)
in which k is the rate constant, while
m and n
represent the order of the reaction according to each reactant. The
overall objective of this experiment is then to determine the rate law
for the bleaching of Brilliant Blue food colorant by sodium
hypochlorite (bleach), and, thus, to find the values of k, m and n.
In
this experiment, the concentration of bleach is much larger than the
concentration of the blue food colorant. Thus, since hypochlorite
ions are
present in great excess in the solution, the change in their
concentration during the reaction will be very small, and, thus, their
concentration is assumed to be
constant throughout the reaction. This kind of approach is called
swamping. Under these conditions, we can use a new rate constant, kobs:
kobs= k [NaOCl]n (equation 3)
Substituting equation 3 into equation 2, the rate law for the bleaching reaction under swamping conditions can be simplified to:
rate = kobs [Blue]m (equation 4)
The
concentration of hypochlorite ions in bleach is known from the results
of a previous experiment or it will be given to you by the professor.
The
concentration
of the blue food colorant in solution will monitored by using
spectrophotometry, also known as ultraviolet-visible spectroscopy, or UV-Vis
spectroscopy (see the section Introduction to Ultraviolet-Visible (UV-Vis) Spectrophotometry and Beer's Law below). In fact, the change in coloration during the
reaction is also clearly visible to the eye.
In Part 1, the wavelength of maximum absorbance (max) of the colorant will be determined.
In Part 2, the concentration of blue colorant will be measured as a function of time by measuring the absorbance of the solution
at 10-second intervals.
Remember that a colored substance absorbs a fraction of the visible
light that goes through it and transmits the rest.
If
a solution is dilute enough, the amount of light absorbed is
proportional to the concentration of the substance (colorant) absorbing
the light, as illustrated by the Beer-Lambert Law:
A = abc (equation 5)
in which:
A is the absorbance. For best results, measurements of absorbance should be measured at the max.
It would be of little use to try to measure the concentration of
a colored substance at a wavelength of light that it does not absorb;
a is the molar absorptivity coefficient or the extinction
coefficient (units M-1cm-1).
The extinction coefficient is constant for a species at a given
wavelength and
represents how much light is absorbed at a particular
wavelength. The extinction coefficient varires with
wavelength so it must be reported with reference to a wavelength of
light;
b is the path length in cm (1.00 cm in the instrument used in this experiment);
c is the concentration in M.
Thus, inPart 3, a calibration curve will be constructed using
aqueous solutions of the blue food colorant of known concentration to verify that the Beer-Lambert law applies.
It is important to make sure that the absorbance of the solution remains
proportional to the concentration over the full range of concentrations
observed during the reaction.
Introduction to Ultraviolet-Visible (UV-Vis) Spectrophotometry and Beer's Law2
Every
chemical substance possesses its own unique set of electronic,
vibrational and rotational energy levels. When electromagnetic
radiation falls upon an atom or molecule, only the energy that
corresponds exactly to the difference between two energy levels in the
atom or molecule is absorbed. The remainder of the electromagnetic
radiation passes on through the sample. This decrease in the amount of
radiation is exactly what a spectrophotometer measures. In the visible
region of the electromagnetic spectrum, most absorptions result in the
transition of an electron from a lower to a higher electronic state in
the sample. These transitions are responsible for the colors we ascribe
to samples, for example, if red is absorbed the sample will appear
green (the complementary color of red). Several factors control the
amount of light absorbed by a sample:
The concentration of the absorbing species
The sample length
The probability of light absorption by the absorbing species (called the molar
absorptivity coefficient or extinction coefficient)
The equation below relates these quantities:
(equation 6)
Where:
Io
is the intensity of incident light;
It
is the intensity of transmitted light;
a
is the molar absorptivity coefficient (constant for a species at a given
wavelength);
b is the path length in cm;
c
is the concentration in moles/liter (M).
Furthermore, is also called the absorbance (A), and the equation A = a b c is called Beer's Law. From this equation, A versus c should be a straight line.
You may find the video below about UV-Visible spectroscopy helpful.3
Data Analysis
In Part 1, determine the wavelength of maximum absorption (max)
and compare to the theoretical value. Calculate the molar absorptivity
(provide the correct units) and compare to the theoretical value.
As
for the analysis of the data, several graphs will be prepared from the
results obtained in Part 2 with the goal of determining the complete rate law:
Graph 1 - the absorbance as a function ot
time. Place all trials on the same set of axes.
Graph 2 - the natural logarithm of
the absorbance vs. time, placing all trials on the same set of
axes.
Graph 3 - the reciprocal
of the absorbance vs. time, combining all trials on the same set of
axes.
For
graphs 2 and 3, it is assumed that the concentration and the absorbance
are proportional. This is what we
verify in Part 3 by graphing absorbance versus concentration and ensuring that it is, in fact, linear.
Among the graphs 2 and 3, the one that shows a straight line
determines the order (m) of the reaction according to the blue food
colorant. Therefore, identify the graph that shows a straight
line and gives the equation of the line and the regression coefficient. The slope of the line is
equal to the magnitude of the constant kobs. Obtain the kobs constant for trials 1 and 2. The kobsconstant
will also be obtained for trial 3 with a diluted solution of bleach
(see procedure below: Part 2 Kinetic Study, step 7).
The order (n) of the reaction
according to NaOCl will be obtained by comparing kobs value of trial 3 with trial 1 using the following equation: kobstrial 3/ kobstrial 1 = k [NaOCl]ntrial 3 / k [NaOCl]ntrial 1 (this method is called the initial rates method). Inthis equation, you want to know the value of n. What is the value of n if approximtely equal values are obtained on the left and right side of the equal sign in?
Calculate the actual rate constant, k, by substituting kobsand[NaOCl]n in thekobs= k [NaOCl]nequation. Write the
complete rate law, including the value for k (with the correct units) and the values of m and n. Compare the rate law and the value of the rate
constant with the literature.
For Part 3,
a calibration
curve is obtained along with, thhe equation of the line and the regression coefficient.
Calculate the extinction coefficient of the blue food colorant.
Provide the correct units. Compare to the literature value and to the value you determined in Part 1.
Safety
Where a lab coat and gloves. The blue food colorant my stain your hands.
Theoretical values for the maximum wavelength of absorption (max) in water (solvent) and the molar absorptivity in water (solvent) of the blue food colorant, Brilliant Blue;
Rate constant, k, for the bleaching of Brilliant Blue by sodium hypochlorite.
Provide your reference.
For Part 1:
Calculate the concentration of the diluted blue dye solution (blue reaction solution).
For Part 3:
Calculate the concentration of calibration solutions 2 to 5.
Create
a table containing the solution number, and, for solutions 2 to 5
include the number of mL pipetted of the previous solution and the
total volume. Also include in the table, the final concentration of
each of the 5 calibration solutions, the absorbance at the max. Complete the table with all the values exept the absorbance at the max.
Prepare a table of observations.
Procedure
Part 1 - Determine max of Brilliant Blue
Pipette 10 mL of0.100 mM stock blue food colorant solutioninto a 100-mL volumetric flask. The concentration of blue food colorant is an approximate concentration. The actual concentration of the
stock solution will be given to you on the day of the experiment.
Fill the flask to the mark with distilled water and mix thoroughly.Thisblue reaction solutionwill be used for Part 2.
Using a plastic pipette, fill
a cuvette with the solution you just prepared.
Place the cuvette into the
sample holder of the spectrophotometer.
Determine the wavelength
of maximum
absorbance by obtaining the visible spectrum of the blue dye between 450 and 750 nm. Use
distilled
water as the blank. To use the spectrophotometer, follow the
instructions of the professor.
Part 2- Kinetic study of the bleaching of Brilliant blue by sodium hypochlorite
The
professor will guide you when using the spectrophotometer. Choose
the kinetics mode of the instrument. Set the instrument to
measure the
absorbance of the kinetic solutions at the max,
every 5 seconds for 60 seconds, every 10 seconds for 60 seconds and
finally every 20 seconds for 120 seconds (total time period = 240
seconds or 4 minutes).
Trial 1 - using the concentrated bleach solution
In a small beaker, pipette
20 mL of theblue reaction solutionprepared in Part 1.
When the instrument is ready, use an Eppendorf
pipette and quickly add 800 µL of bleach to
the beaker containing blue reaction solution. It is important
to add the bleach only when the instrument is ready, not before and not
after, as the blue color of the dye solution will begin to fade
immediately upon the addition of the bleach.
Mix thoroughly and
transfer
part of the mixture into a cuvette as quickly as possible. Without
delay, place the cuvette into the sample holder of the
spectrophotometer.
Immediately begin measuring the concentration of the blue colorant solution as a function of time.
Since
it is not possible to observe what is happening in the cuvette inside the
spectrophotometer, observe the contents of the beaker to see what happens over the 4-minute time interval.
Trial 2 - using the concentrated bleach solution
Perform a second trial by adding to a clean beaker, in the following order: 20 mL ofblue reaction solution, then 800 µL
of bleach. Remember that the bleach should only be
added to the beaker when the instrument is ready!! The professor
will be there to help you.
Trial 3 - using the diluted bleach solution
Next perform one last trial by adding 20 mL of blue reaction solution, then 800 µL
of diluted bleach solution (that is half the concentration of the one used in trials 1 and 2) to a clean beaker.
During the waiting times, you may begin to prepare the solutions for the calibration curve in Part 3.
Part 3 - Verify the Beer-Lambert law with the construction of a calibration curve
In order to prepare the calibration curve, a serial dilution of the blue reaction solution will be performed. Prepare these solutions during the
waiting times of the kinetics experiment performed in Part 2.
A serial dilution is the
stepwise dilution of a substance in solution. Usually, the
dilution factor is constant at each step, resulting in the progressive
lowering of the concentration in logarithmic fashion. In this
experiment, a two-fold serial dilution will be made because each
solution is half the concentration of the next most concentrated
solution.
Using a graduated pipette,
add 25 mL of theblue reaction solution(solution 1) to
a 50-mL volumetric flask. Fill the flask to the mark with
distilled water and mix thoroughly. This represents solution 2.
Next,
pipette 25 mL of solution 2 and place it into another 50-mL
volumetric flask. Add distilled water to the mark and thoroughly
mix. This represents solution 3.
Then, pipette 25 mL of
solution 3 and place it into another 50-mL volumetric flask. Add
distilled water to the mark and thoroughly mix. This represents
solution 4.
Finally, pipette 25 mL of
solution 4 and place it into another 50-mL volumetric flask. Add
distilled water to the mark and thoroughly mix. This represents
solution 5.
Using the max,
measure the absorbance of each solution. The professor will guide you when using the spectrophotometer.
Create a calibration
curve (absorbance vs. concentration).
References
Arce J, Betancourt R,
Rivera Y, Pijem J. The reaction of a food colorant with sodium hypochlorite: a
student-designed kinetics experiment. J Chem Educ [Internet]. 1998 Sep [cited
2024 Feb 19];75(9):1142. Available from: https://pubs.acs.org/doi/abs/10.1021/ed075p1142
Brown TL, LeMay HE Jr., Bursten BE, Murphy CJ, Woodward PM,
Stoltzfus MW, Lufaso MW. Chemistry: The Central Science, 14th edition. USA:
Pearson Education, Inc.; c2018. Chapter 14, Chemical Kinetics, p576
Professor Davis, ChemSurvival. How a simple UV-Visible spectrophotometer
works [Internet]. YouTube; 2014 [cited 16 Feb 2023]. Available from: https://www.youtube.com/watch?v=oysDkHz1pgA


 products (aq)
(equation 1)
 max) of the colorant will be determined.
 (equation 6)
 is also called the absorbance (A), and the equation A = a b c is called Beer's Law. From this equation, A versus c should be a straight line.