


In this experiment, the concentration of a dye in Gatorade will be determined spectrophotometrically using a standard calibration curve. The extinction coefficient or molar absorptivity coefficient of the dye will also be determined. An introduction to color additives (also known as food coloring or dyes) and UV-Visible spectroscopy is given below.
Color additives
For centuries, color additives, also known as food coloring or dyes, have been added to food to maintain or improve its appearance. We have come to expect that a strawberry milkshake will be pink in color, or that M&Ms candies be a fun and festive mix of many different colors. It would be boring to eat a package of brown M&Ms candies. Food coloring is also used in the cosmetic, pharmaceutical and medical industries. For example, we expect that mint toothpaste be light blue in color. Furthermore, different colors of Tylenol (acetaminophen) tablets are manufactured to be able to distinguish between their different strengths.
With the onset of the industrial revolution in the late 1700s, people began to move from their rural homesteads to the centers of industrialization. People in these urban areas were no longer able to grow and prepare their own food, and, so relied on others to do so. The producing and trading of food, thus, became a huge highly competitive industry that lacked government regulation. As a result, color additives were added to food to cover the fact that some foods were in the process of spoiling or to mask the fact that some foods had already spoiled. Thus, the adulteration of food (adulterated food is impure, unsafe or unwholesome food) became rampant. Many of the color additives contained metals, such as lead and copper, and so the foods that they were added to also became contaminated, causing serious health problems that sometimes resulted in death. Luckily today, the (Health Products and Food Branch) of Health Canada manages the health-related risks and benefits of health products and food in Canada. While in the United States, the Food and Drug Administration regulates and enforces laws on food safety as well as food defense.
In the Canada, as well as in the US, the List of Permitted Colorings Agents provides seven artificial colorings are permitted to be added to food:
All seven are organic molecules. The three studied in this experiment are FD&C Red No. 40, FD&C Yellow No. 5 and FD&C Blue No. 1 (see Figure 1).
| Figure 1. Structure and name of certain colorants used in this experiment | ||
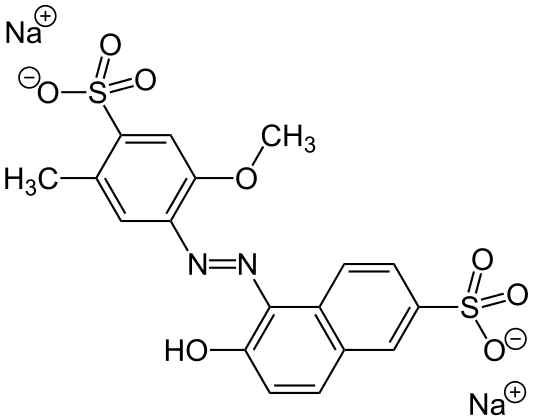 | FD&C Red No. 40 (Allura red) Molar mass = 496.42 g/mol | |
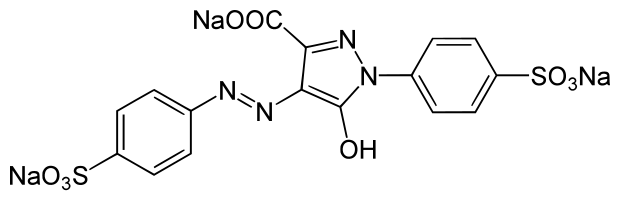 | FD&C Yellow No. 5 (Tartrazine) Molar mass = 534.36 g/mol | |
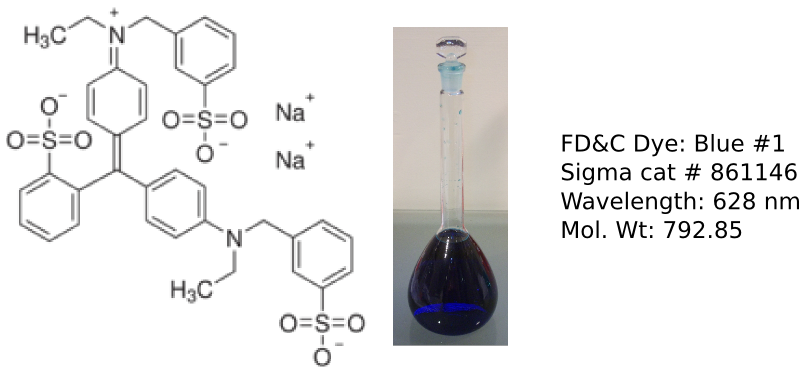 | FD&C Blue No. 1 (Erioglaucin or Brilliant Blue) molar mass = 792.84 g/mol | |
Controvery has surrounded the use of food dyes since the 1970s when Dr. Benjamin Feingold first claimed a link between Attention Deficit Hyperactivity Disorder (ADHD) in children and the consumption of food colorings (Artificial Food Colors and Attention-Deficit/Hyperactivity Symptoms: Conclusions to Dye for). The possible carcinogenicity of color additives has also been proposed.
UV-Visible spectroscopy
Although
the eye can discern differences in color intensity with reasonable
accuracy, an instrument known as a spectrophotometer is used for this
purpose because it eliminates human error. A spectrophotometer
shines a single wavelength of light of a known intensity into a
solution, and then measures the intensity of the light exiting the
solution. The wavelength at which the maximum amount of light is absorbed is called
the  max (pronounced lambda-max:
the wavelength of maximum absorption). If a solution contains a
compound that absorbs light, the intensity of light exiting the
solution will be less than the intensity of light that entered the solution. Conversely,
if none of the compounds in the solution absorb at that wavelength of
light, then the intensity of the light exiting the solution will be the
same as that entering the solution. Thus, the spectrophotometer
measures the decrease in the amount of light passing through a sample, which is depicted in the image below.
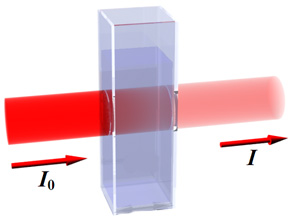
Most absorptions result in the transition of electrons in the sample from a lower to a higher electronic state. These transitions are responsible for the colors we ascribe to samples - if red is absorbed the sample will appear green (complementary color of red). Several factors control the amount of light absorbed by a sample:
These quantities are related by the following equation:

where
| Io | is the intensity of incident light |
| It or I | is the intensity of transmitted light |
| a | is the molar absorptivity coefficient or the extinction coefficient. Units are M-1cm-1. The molar absorptivity is a constant for a species at a given wavelength and represents how much light is absorbed at a particular wavelength. The molar absorptivity varies with wavelength so it must be reported with reference to a wavelength of light. |
| b | is the path length in cm |
| c | is the concentration in moles/liter |
 |
is also called the absorbance or A. |
This equation can be simplified to A = abc which is called Beer's Law. From this equation, A is directly proportional to the concentration. Thus, if we were to prepare several solutions of various solute concentrations, measure the absorbance of each solution, and then plot absorbance versus concentration, we should get a straight line with a y-intercept of 0 and a slope of ab. With this graph (known as a standard calibration curve or simply a calibration curve), we would be able to determine the concentration of the solute in any solution just by measuring its absorbance. This is, in a nutshell, what we will be doing in this experiment to determine the concentration of dye in Gatorade.
Depending on the color of Gatorade assigned to you, determine the total volume of the calibration solutions AND calculate the [blue dye] in Table 1 below or the [red dye] in Table 2 below in each of the calibration solutions before coming to the lab.
Pipet all solutions using a pipetting aid. Wear your safety glasses.
Depending on the color of Gatorade assigned to you, prepare the solutions in Table 1 (Blue) or Table 2 (Red). Obtain and label six (6) large test tubes with the solution number given in the table 1 or 2. To prepare the solutions, use a graduated pipet to add the volume of the stock dye solution to a large test tube. Using another graduated pipet, add the required volume of H2O. Thoroughly mix the contents using the vortex.
| Use this table to prepare the calibration solutions for BLUE Gatorade only | |||||
| Table 1. Volumes of stock blue dye solution (0.01 mg/mL) and water required to prepare the calibration solutions | |||||
| Solution | Volume of stock blue dye solution (mL) |
Volume of H2O (mL) | Total volume (mL) | Concentration (mg/mL) | Absorbance |
| 0 (blank) | 0 | 10.00 | |||
| 1 | 1.00 | 9.00 | |||
| 2 | 2.00 | 8.00 | |||
| 3 | 3.00 | 7.00 | |||
| 4 | 4.00 | 6.00 | |||
| 5 | 5.00 | 5.00 | |||
| Use this table to prepare the calibration solutions for RED Gatorade only | |||||
Table 2. Volumes of stock red dye solution (0.02 mg/mL) and water required to prepare the calibration solutions | |||||
| Solution | Volume of stock blue dye solution (mL) |
Volume of H2O (mL) | Total volume (mL) | Concentration (mg/mL) | Absorbance |
| 0 (blank) | 0 | 10.00 | |||
| 1 | 2.00 | 8.00 | |||
| 2 | 4.00 | 6.00 | |||
| 3 | 6.00 | 4.00 | |||
| 4 | 8.00 | 2.00 | |||
| 5 | 10.00 | 0.00 | |||
Using the most concentrated solution (solution 5),
collect the absorption spectrum of the color
of dye assigned to you. The instructor will be with you to operate the
spectrophotometer. To do so, fill the cuvettes approximately 3/4 full of the
calibration solution 5. Wipe
the outside of the cuvettes with a Kim-wipe. Handle the cuvettes only
by
the frosted sides and with extreme care as they are very fragile. Place
the cuvettes in the sample holder and obtain the UV-Visible spectrum.
From the spectrum, determine the range of the absorption spectrum and the
wavelength of maximum absorption, max.
Next,
measure the absorbance of each calibration solution at the max. After measuring the absorbance of each
calibration
solution, construct a calibration curve in Excel by plotting
absorbance versus
[dye]. Obtain the equation of the line and the regression coefficient. Calculate the molar
absorptivity coefficient of the dye.
Blue Gatorade: Fill a clean cuvette with blue Gatorade and measure its absorbance. Calculate the [blue dye] in Gatorade using the equation of the line obtained from the calibration curve.
Red Gatorade: Dilute the red Gatorade 5 times. Fill a clean cuvette with the diluted solution and measure its absorbance. Calculate the [red dye] in the original Gatorade sample using the equation of the line obtained from the calibration curve. When calculating the [red dye] in the original Gatorade sample, do not forget to take into consideration the fact that you diluted the original Gatorade sample by 5-fold.